

KS2 Results
Summary of End of Key Stage 2 Results - 2024/25
|
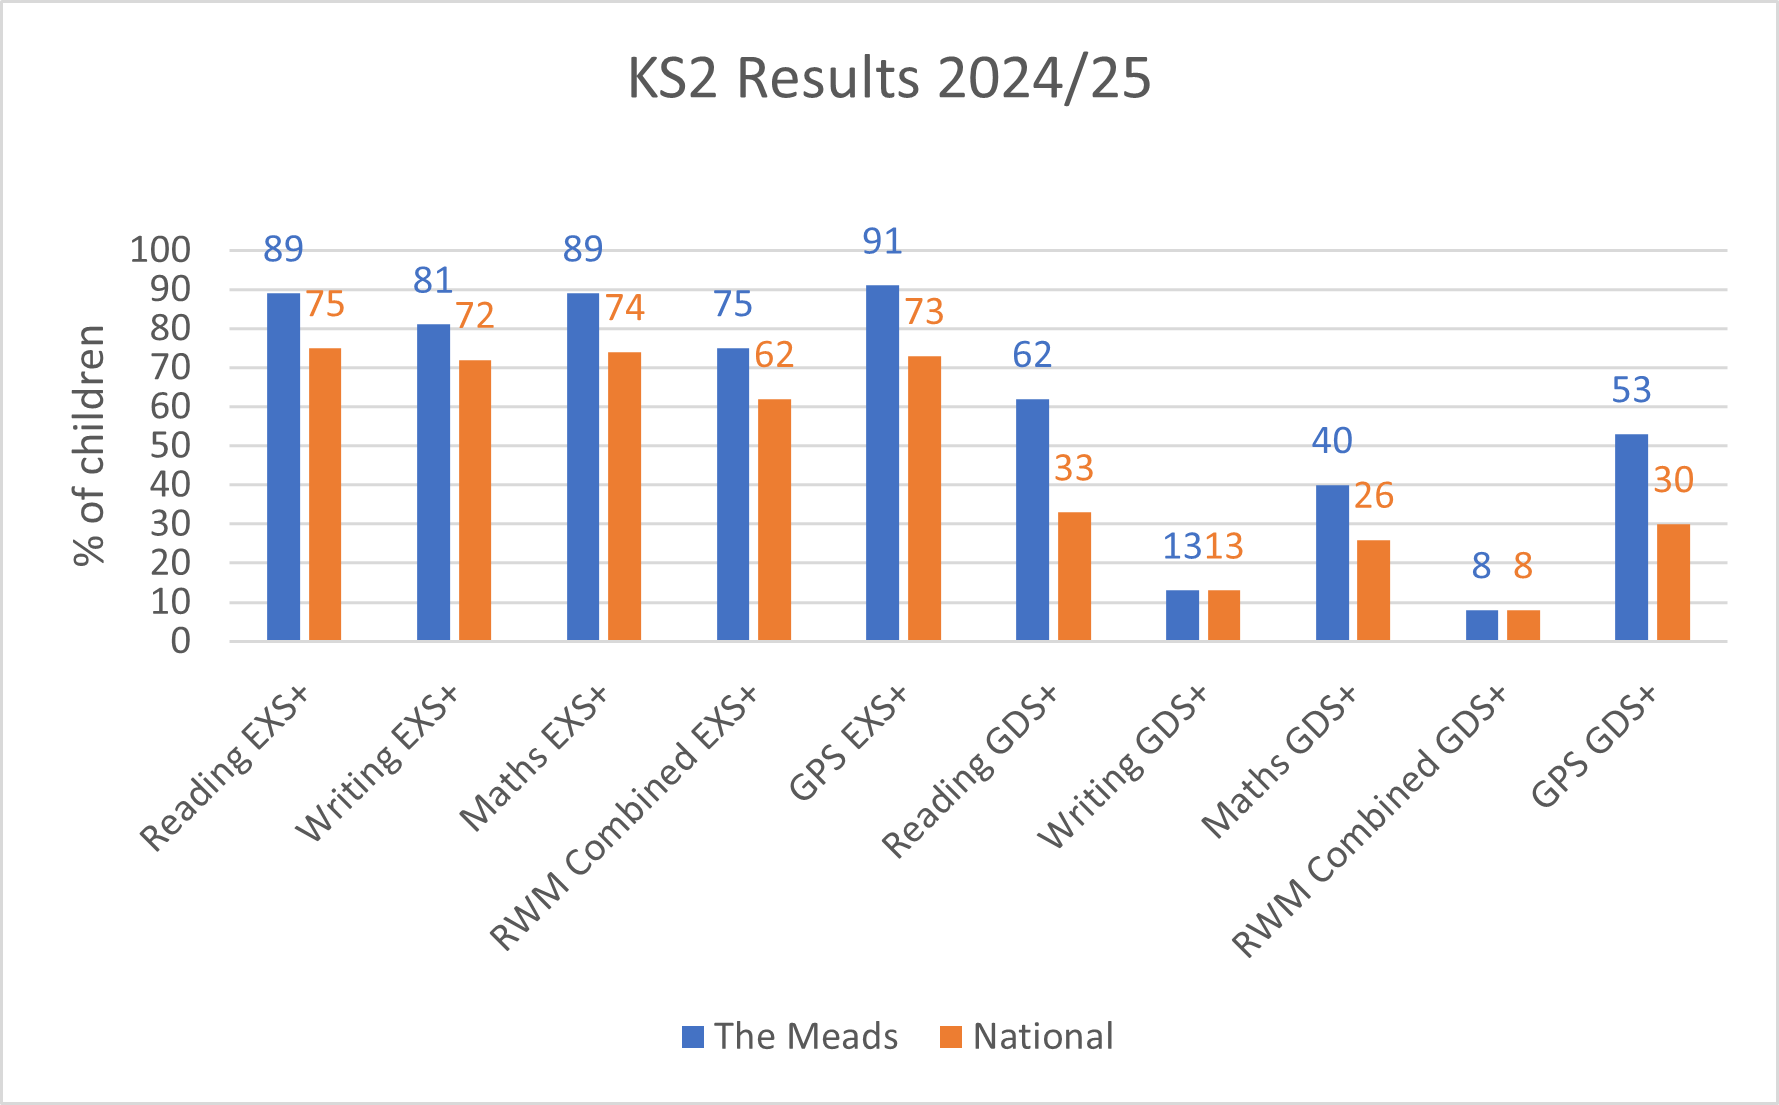
Performance summary of overall Keystage 2 Results |
||||||
| Subject | Expected Standard+ The Meads |
Expected Standard+ National |
Expected Standard+ Gap |
Greater Depth |
Greater Depth National |
Greater Depth Gap |
| Reading | 89% | 75% | +14% | 62% | 33% | +29% |
| Writing | 81% | 72% | +9% | 13% | 13% | 0% |
| Maths | 89% | 74% | +15% | 40% | 26% | +14% |
| RWM Combined | 75% | 62% | +13% | 8% | 8% | 0% |
| Grammar, punctuation and spelling | 91% | 73% | +18% | 53% | 30% | +23% |
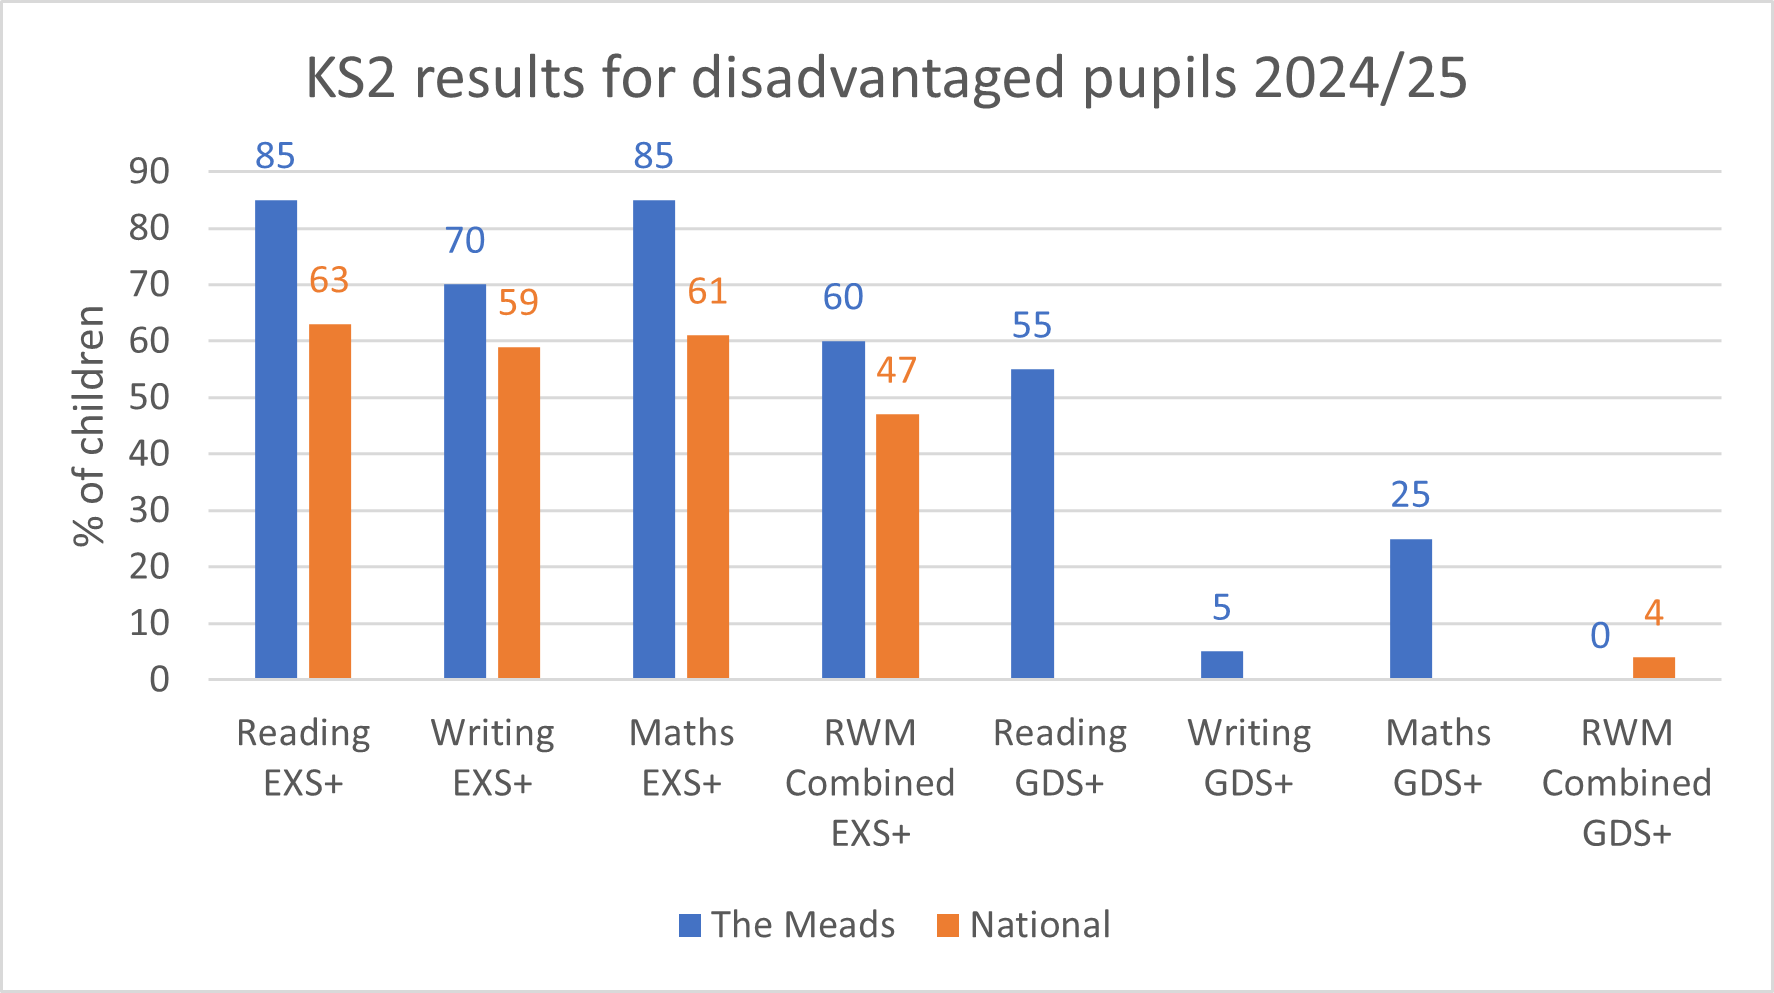
| Performance summary of disadvantaged pupils | ||||
| Subject | Expected Standard+ The Meads |
Expected Standard+ National |
Greater Depth The Meads |
Greater Depth National |
| Reading |
85% |
63% | 55% | |
| Writing | 70% | 59% | 5% | |
| Maths | 85% | 61% | 25% | |
| RWM Combined | 60% | 47% | 0% | 4% |
KS2 Results (3-year trend)
| The Meads/National 3-year trend all subjects - Expected Standard+ | ||||||
| 2022/23 | 2023/24 | 2024/25 | ||||
| Subject | The Meads | National | The Meads | National | The Meads | National |
| Reading | 77% | 73% | 84% | 74% | 89% | 75% |
| Writing | 67% | 71% | 74% | 72% | 81% | 72% |
| Maths | 71% | 73% | 82% | 73% | 89% | 74% |
| RWM Combined | 53% | 59% | 72% | 61% | 75% | 62% |
| Grammar, punctuation and spelling | 80% | 72% | 88% | 72% | 91% | 73% |
| The Meads/National 3-year trend all subjects - Greater Depth | ||||||
| 2022/23 | 2023/24 | 2024/25 | ||||
| Subject | The Meads | National | The Meads | National | The Meads | National |
| Reading | 27% | 29% | 34% | 28% | 62% | 33% |
| Writing | 4% | 13% | 14% | 13% | 13% | 13% |
| Maths | 23% | 24% | 37% | 24% | 40% | 26% |
| RWM Combined | 2% | 8% | 12% | 8% | 8% | 8% |
| Grammar, punctuation and spelling | 24% | 30% | 49% | 32% | 53% | 30% |
| The Meads/National 3-year trend averaged scaled scores | ||||||
| 2022/23 | 2023/24 | 2024/25 | ||||
| Subjects | The Meads | National | The Meads | National | The Meads | National |
| Reading | 105 | 105 | 107 | 105 | 110 | 106 |
| Grammar, punctuation and spelling | 106 | 105 | 108 | 105 | 111 | 105 |
| Maths | 104 | 104 | 106 | 104 | 108 | 105 |
Average scaled scores
The scaled score indicator is only applicable for reading and maths and ranges between 80 - 120.
An average scaled score of 100 is the expected national pass benchmark.
For further information click here to view the primary school performance tables.